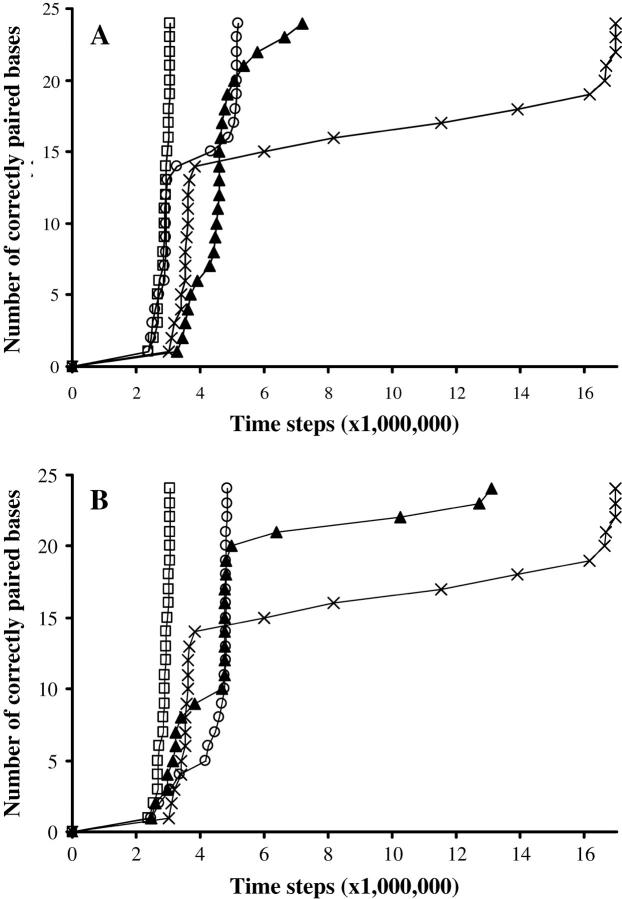
FIGURE 3.
Effect of substitutions. (A) Effect of the number of substitutions. Symbol key: □, random sequence with no substitution; ○, two adjacent substitutions in a central position; ×, three adjacent substitutions in a central position; ▴, eight non-adjacent substitutions scattered along the molecule. (B) Effect of the position of substitutions. Symbol key: □, random sequence with no substitution; ○, three adjacent substitutions at one extremity; ×, three adjacent substitutions in the center; ▴, three adjacent substitutions at one-quarter of the end of the molecule. Data for A and B: 100 simulations per curve; N = 24, Ehom = – 5.5, Ehet = −1.5, Erep = 2, Ecoopbind = 2, and d = 0.45.

