
FIGURE 3.
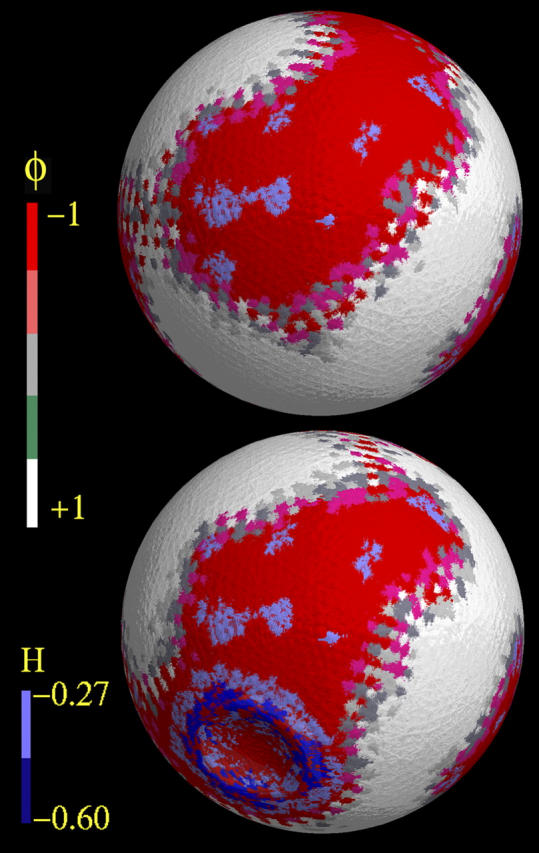
Dynamic composition coupling to induced curvature. The upper image is a snapshot of the smooth GUV as in Fig. 1 b, but rotated slightly. The lower image is the same system in exactly the same orientation, but with a dent located at the x-axis poles. Both snapshots were obtained after 700 μs with CH dynamics, with starting conditions as described in Composition Dynamics of GUVs: Static Membrane. The color-coding for the composition is given in the bar on the left of the image, where red corresponds to φ ∼ −1 and white corresponds to φ = +1. The blue regions are the local curvature field superimposed on the images.