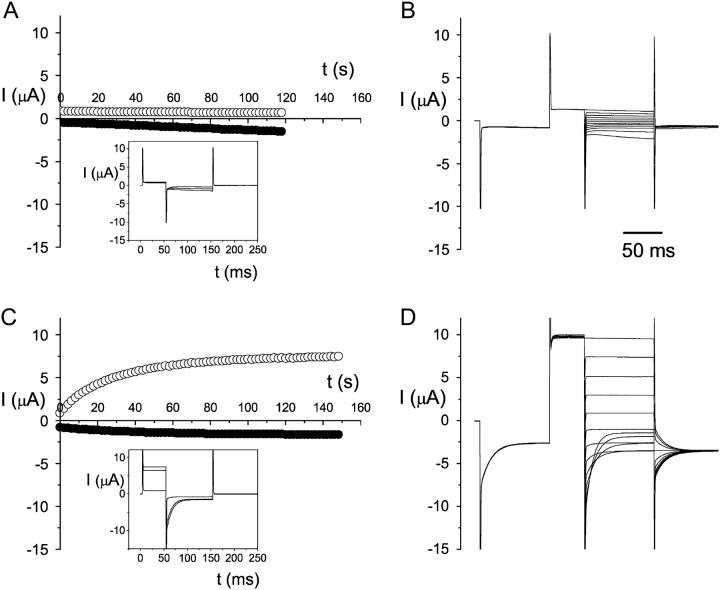
FIGURE 2.
Effect of β-ME on the oxidized WT ClC-0 current. Whole-oocyte current was compared before (A and B) and after (C and D) 5 mM β-ME treatment for 1 h. Temperature was ∼20°C. (A) Time course of current activation by protocol 1, with one pulse every 2 s. The current at the end of +60 mV (○) and −150 mV (•) are plotted against time. The recording traces within the inset box are taken from 0-, 58-, and 118-s time points, respectively. The oocyte current did not increase significantly, even though a −150 mV voltage step for 100 ms was applied every 2 s. (B) After the recordings in A, the same oocyte was immediately evaluated with protocol 2, with the test voltages from +60 mV to −160 mV in −20-mV steps. (C and D) Whole-cell current of the same oocyte as that examined in A and B after the oocyte was treated with β-ME. The experimental manipulations in C and D were the same as those in A and B, respectively. Current traces in the inset box are the same time points as those described in A. Notice that the current measured at +40 mV is monotonically increased to a much higher level by the −150 mV voltage step (see ○in C), and the current deactivation at negative potentials is prominent, resulting in the typical crossover of the recording traces at negative voltages (see recording traces at −120, −140, and −160 mV in D).

