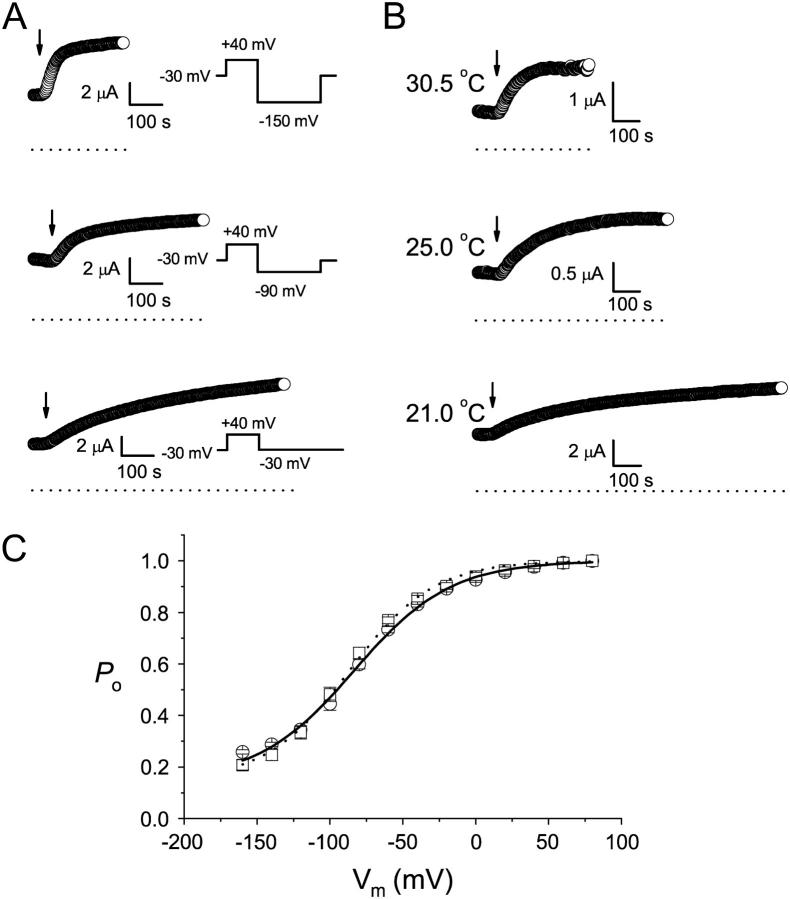
FIGURE 6.
Current induction of the K165C heterodimer by MTSET. (A) Voltage dependence of the current induction. The oocyte current was monitored by the voltage pulse shown on the right. The indicated voltages were the potentials applied during the pulse. Each circle represents the current amplitude measured at the end of the +40 mV voltage step. Arrows indicate the time point at which 30 μM MTSET was applied. (B) Temperature dependence of the current induction. Oocyte current was monitored by the pulsing protocol as in the bottom panel of A, and each circle is the current measured at the end of the +40 mV voltage step. All oocytes in A and B were incubated in ND96 without β-ME for at least 2 h before the experiments. (C) Comparison of the fast-gate Po-V curves of the MTSET and β-ME-treated K165C heterodimers. Data points were the average of three independent measurements. MTSET, 100 μM; β-ME, 2 mM. The solid and dotted curves were drawn according to a Boltzmann equation: Po = Pmin + (1 − Pmin)/[1 + exp(−zF(V − V1/2)/RT)], with Pmin = 0.15. The values of V1/2 and z were: −83 mV and 0.77, respectively, for β-ME (circles), and −86 mV and 0.89 for MTSET (squares).

