
FIGURE 5.
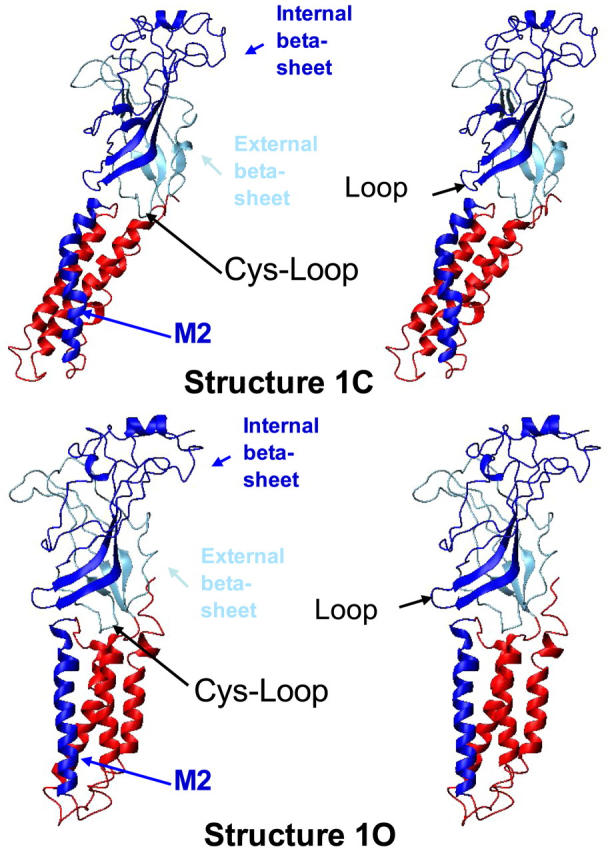
Conformational change between structures 1C and 1O at the tertiary structure level. Only one subunit is represented. The internal β-sheet and M2 helix are represented in blue, the external β-sheet is represented in light blue and the rest of the protein is displayed in red.