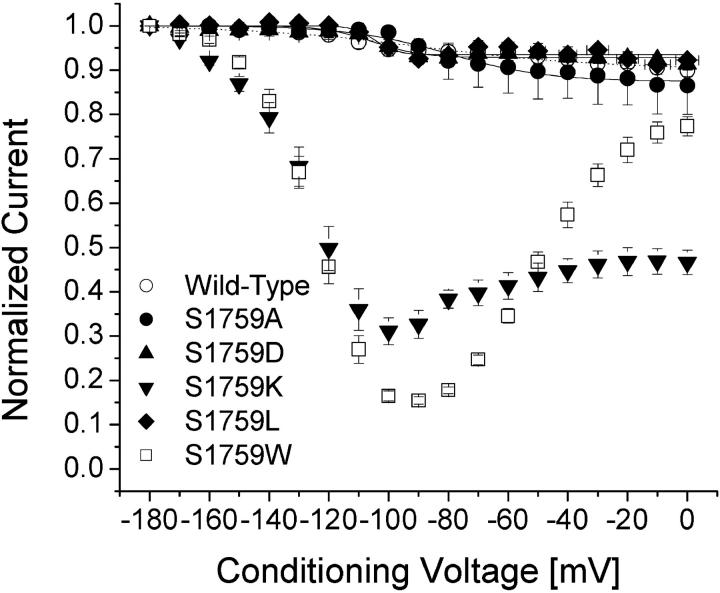
FIGURE 5.
Slow inactivation of Nav1.5 wild-type and mutant channels. Data were obtained as in Fig. 4 and normalized to the peak amplitude after the −180 mV conditioning pulse. Normalized data were plotted against the conditioning prepulse voltages. Data were fitted with a Boltzmann function (1/[1 + exp((V0.5 − V)/KE)]). The average V0.5 value and KE (slope factor) and Y0 values (in parentheses) for the fitted functions were −103.4 ± 5.1 mV and 12.8 ± 4.0 mV (0.92 ± 0.04), respectively, for Nav1.5 wild-type (○, n = 6); −80.1 ± 2.8 mV and 16.5 ± 2.8 mV (0.87 ± 0.05), respectively, for Nav1.5-S1759A (•, n = 5); −105.2 ± 2.6 mV and 8.1 ± 2.3 mV (0.93 ± 0.03), respectively, for Nav1.5-S1759D (▴, n = 5); and −104.6 ± 2.7 mV and 3.4 ± 1.9 mV (0.94 ± 0.03), respectively, for Nav1.5 S1759L (♦, n = 5). Plots for Nav1.5-S1759K (▾) and Nav1.5-1759W (⋄) were not fitted well with a Boltzmann function.

