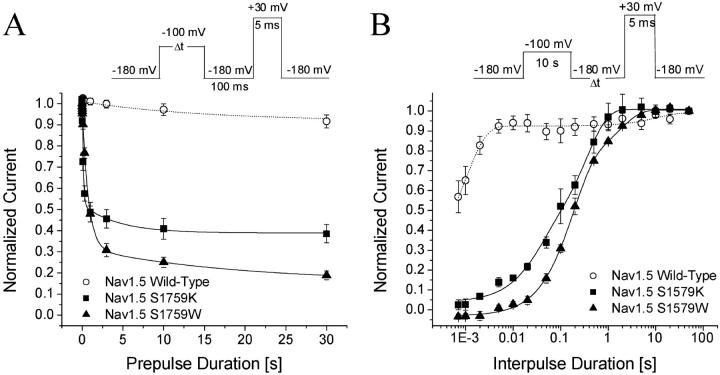
FIGURE 6.
Development of and recovery from slow inactivation. (A) For the development of slow inactivation, a pulse protocol shown in the inset was applied. The peak currents at the test pulse were measured and normalized to the initial peak amplitude (t = 0) and plotted against the prepulse duration. The data were fitted by a single-exponential or, when appropriate, a double-exponential function. Time constants (and final Y0 values in %) for Nav1.5 wild-type (○, n = 5), Nav1.5-S1759K (▪, n = 5), and Nav1.5-S1759W (▴, n = 5) were 15.0 ± 13.4 s (91.7 ± 3.7%), (t1) 0.12 ± 0.01 s, (t2) 4.4 ± 2.1 s (38.5 ± 1.4%), and (t1) 0.70 ± 0.04 s, (t2) 10.8 ± 2.8 s (18.8 ± 0%), respectively. Cells were held at −180 mV. (B) The recovery from slow inactivation was measured by the pulse protocol shown in the inset. The peak currents at the test pulse were measured, normalized, and plotted against the interpulse duration. The recovery time courses were fitted by the sum of two exponentials. The fast and slow time constants were 0.0010 ± 0.0002 s and 10.5 ± 7.8 s (wild-type, ○, n = 5), 0.40 ± 0.05 s and 0.030 ± 0.009 s (S1759K, ▪, n = 5), and 1.7 ± 0.3 s and 0.20 ± 0.01 s (S1759W, ▴, n = 5). Cells were held at −180 mV. We noticed that during a 10-s conditioning pulse nonlinear leak currents might arise in some cells. Such nonlinear leak could not be corrected by the P/-4 protocol.

