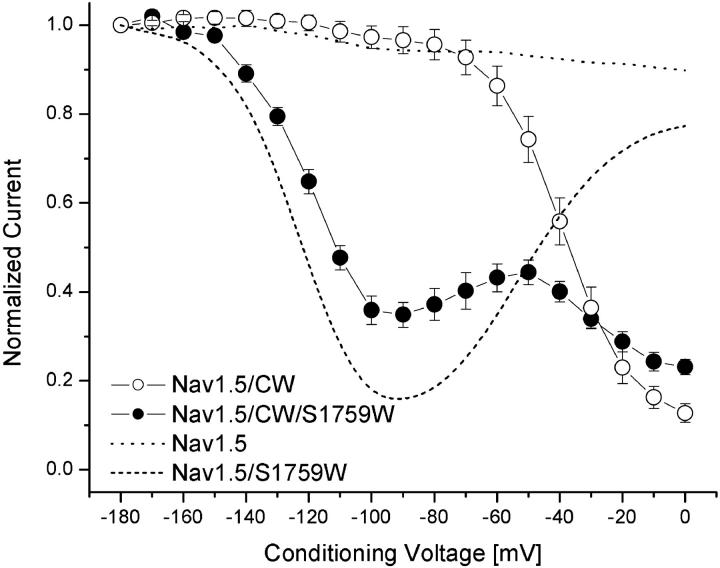
FIGURE 7.
Voltage dependence of slow inactivation in inactivation-deficient hNav1.5-CW (○) and hNav1.5-CW/S1759W (•) mutant Na+ channels. Inactivation-deficient Na+ currents were recorded with an identical pulse protocol as shown in Fig. 4 A, and data were analyzed as described in Fig. 5; n = 6 and 5 for open and solid circles, respectively. For comparison, wild-type hNav1.5 (dotted line) and hNav1.5-S1759W mutant Na+ channels are shown.

