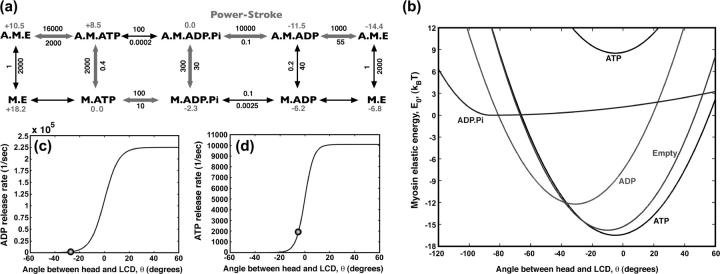
FIGURE 2.
The mechanochemistry of a single myosin motor. (a) The kinetic cycle is shown along with the measured rate constants for the reactions  in s−1. The relative free energies of the states are also displayed. The most probable kinetic pathway is shown in heavy arrows, although no particular pathway is assumed in our model. All of the observed states are included. (b) The myosin motor energy as a function of the angle θ, defined in Fig. 1. The free energy differences between equilibrium conformations are given by the kinetic constants. The M.* states have the exactly the same shape as the corresponding A.M.* states except for additive constants. (c) The kinetic rate constant as a function of θ for ADP release from A.M.D and (d) ATP release from A.M.T. The functions have a sigmoidal shape, as explained in the text. At the equilibrium conformation, θ0 (indicated as spheres), the rate constants correspond to the experimental values with purified proteins.

