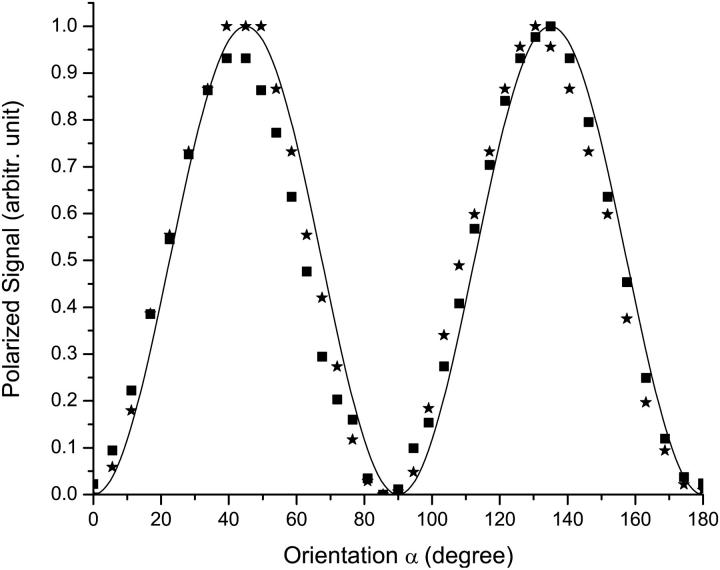
FIGURE 9.
Minimum intensities were subtracted as baselines of the structural polarized signals from two different nerves (square and star spots) shown in Fig. 5, respectively. The maximum intensities were normalized to 1. The black solid trace shows our predictions from the model.

