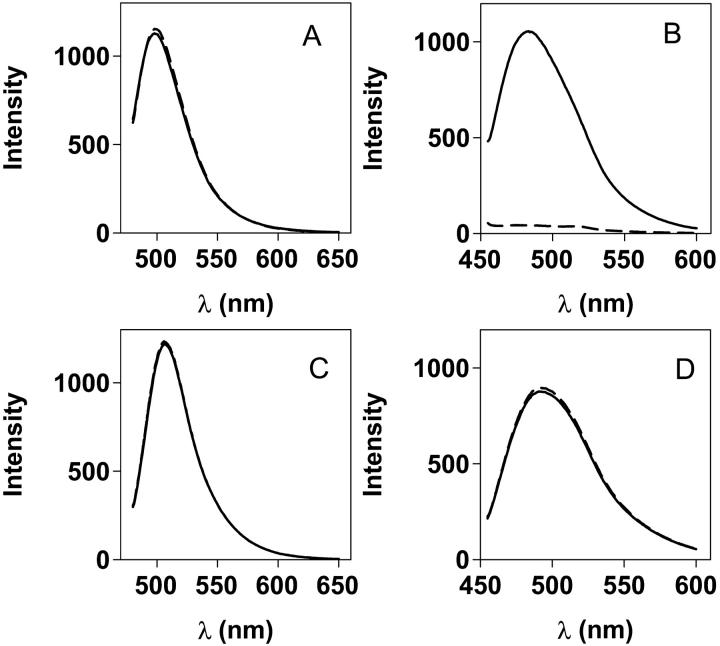
FIGURE 11.
pH sensitivity on fluorescence of DCVJ and ThT. TTR aggregates were generated from acid unfolded TTR, which was incubated at A-state conditions for 24 h (14 μM monomer concentration). Spectra were recorded from mixing 5 μM TTR (monomer concentration) and 5 μM dye in different buffers. (A) TTR aggregates + DCVJ in 50 mM Tris-HCl (pH 7.5; solid line) and in 40 mM Na-acetate (pH 3.0; dashed line) (B) TTR aggregates + ThT in 50 mM Tris-HCl (pH 7.5; solid line) and in 40 mM Na-acetate (pH 3.0; dashed line). (C) DCVJ (5 μM) without protein in 80% glycerol buffered with 50 mM Tris-HCl (pH 7.5; solid line); 40 mM Na-acetate (pH 3.0; dashed line); 25 mM HCl (pH 1.6; dotted line). (D) ThT (5 μM) without protein, same buffers as in C.

