
FIGURE 5.
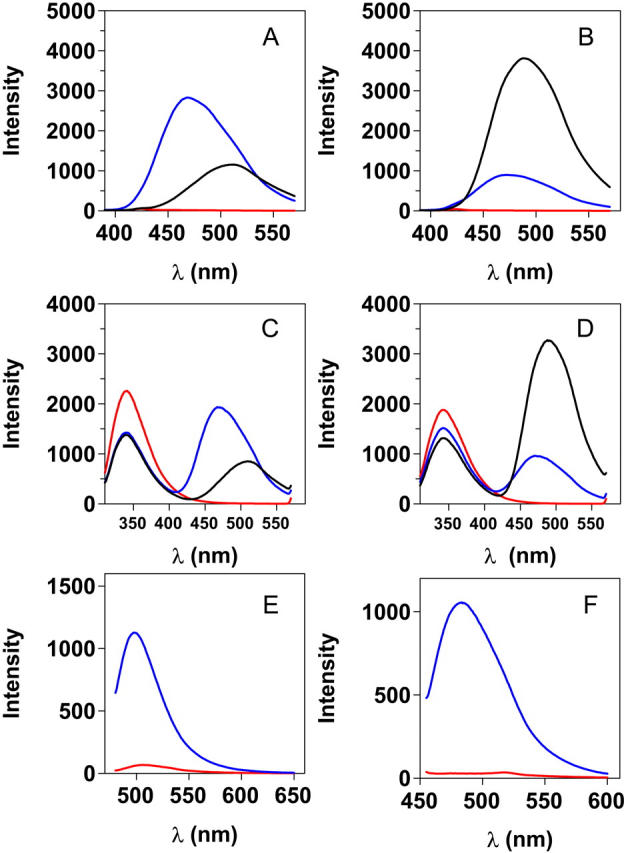
Fluorescence spectra of the different probes binding to native and misfolded aggregated TTR. Aggregates were generated from A-state incubation at 14 μM monomer concentration. (A) Native TTR binding, direct excitation (370 nm) of ANS (blue) and Bis-ANS (black; 2 μM probe + 2 μM TTR tetramer). The red curve shows TTR in the absence of probe. (B) ANS and Bis-ANS fluorescence, after direct excitation (370 nm), bound to protofibrillar and spherical aggregates of TTR (2 μM probe + 2 μM TTR monomer concentration; A-state incubation for 24 h). Same color code as in A. (C) Emission spectra after Trp excitation at 290 nm of native TTR. Same color code as in A. (D) Emission spectra after Trp excitation at 290 nm of protofibrillar and spherical aggregates of TTR. Same color code as in A. (E) DCVJ spectra in the presence of native TTR (red) and misfolded oligomers of TTR (A-state incubation for 2 h; blue; 5 μM DCVJ + 5 μM TTR monomer concentration). (F) ThT spectra in the presence of native TTR (red) and misfolded oligomers of TTR (A-state incubation for 2 h; blue; 5 μM ThT + 5 μM TTR monomer concentration).