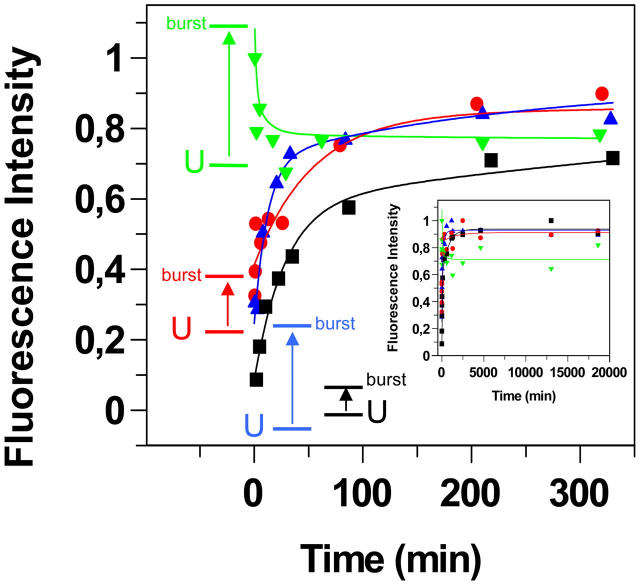
FIGURE 6.
Kinetics of TTR misfolding and aggregation followed by different fluorescent probes. Aliquots of the aggregation reaction (A-state incubation at 14 μM monomer concentration) was withdrawn and assayed at 2 μM probe + 2 μM TTR. The corrected and integrated fluorescence spectra from the different probes were normalized by the maximum intensity for each probe. Symbols: ANS (red circles), Bis-ANS (green triangles), DCVJ (blue triangles), and ThT (black squares). The fluorescence intensity of the different probes in the presence of the unfolded monomer state and the burst amplitude from the fit is indicated with horizontal lines labeled with the letter U and “burst” in colors corresponding to the probe. The kinetic trace over the initial 6 h is shown in the main figure, the complete kinetic trace (>300 h) is shown in the inset, and the rate parameters are summarized in Table 1.

