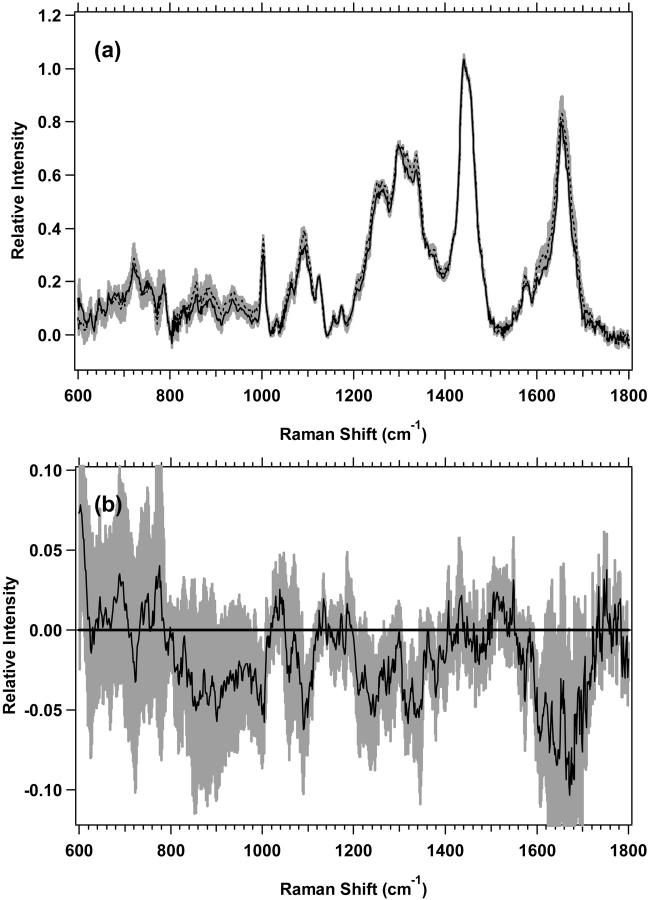
FIGURE 7.
(a) Standard deviations (shaded area) overlying the averages are shown from 600 to 1800 cm−1 for MR1 plateau (solid line) (n = 3) and exponential (dotted line) (n = 3) nuclei. The spectra have been normalized to the integrated intensity from 1437 to 1453 cm−1. (b) Difference spectrum for MR1 plateau minus MR1 exponential nuclei, with its standard deviation, is shown.

