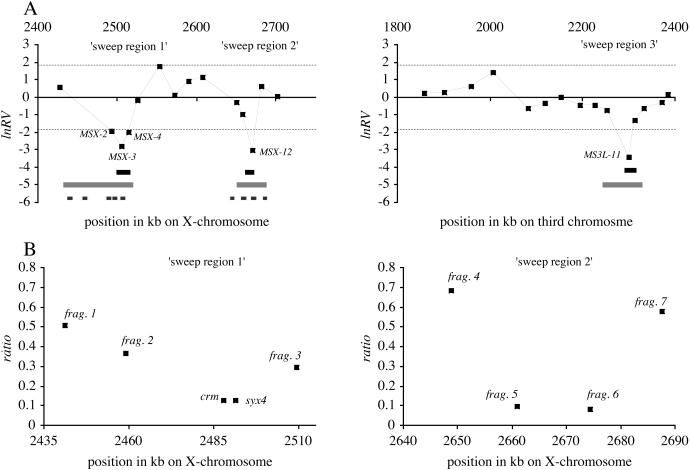
Figure 1.
Relative variability estimates in regions affected by a selective sweep. (A) Location of microsatellite loci in polytene band 3B-C (X chromosome) and 62E (left arm of chromosome 3) and their respective variability expressed as standardized lnRV values. Both chromosomal segments have approximately the same distance from the tip of the chromosome and exhibit comparable and intermediate levels of recombination. The 95% confidence interval of the lnRV statistic is indicated by dashed lines. The gray line marks the extension of the conservative larger mapping interval (see Results for explanation). Black lines above gray lines indicate the mapping interval using a deterministic hitchhiking model (hitchhiking-mapping interval; see Materials and Methods). Small boxes below mapping intervals indicate the position of the sequenced DNA pieces. Positions are given relative to the start of the chromosome of according to release 2 of the complete D. melanogaster genomic sequence. (B) Ratio of nucleotide diversities (π, average number of pairwise differences) in European and African populations in X-chromosomal sweep regions 1 (Left) and 2 (Right).

