
FIGURE 3.
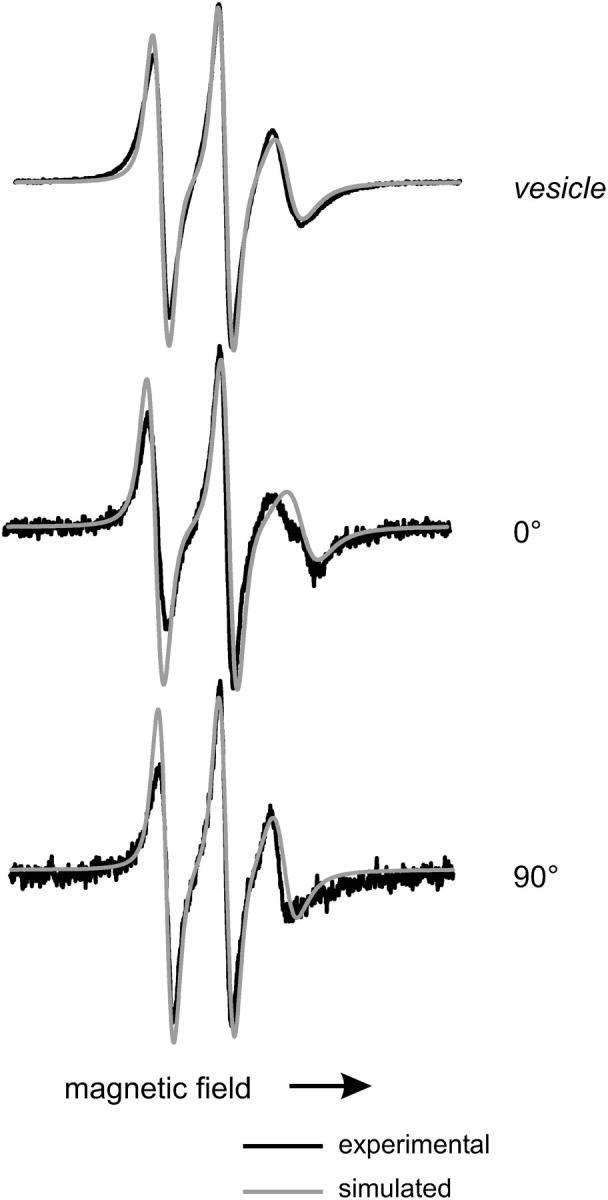
EPR spectra of DOPC/DOGS-NTA/14-doxyl PC (88/10/2 mol%) lipid SUVs and bilayer supported on quartz at the indicated polar angle with respect to the surface normal; scan width is 100 G. The black traces are experimental spectra and the red traces are NLSL fits (see Materials and Methods).