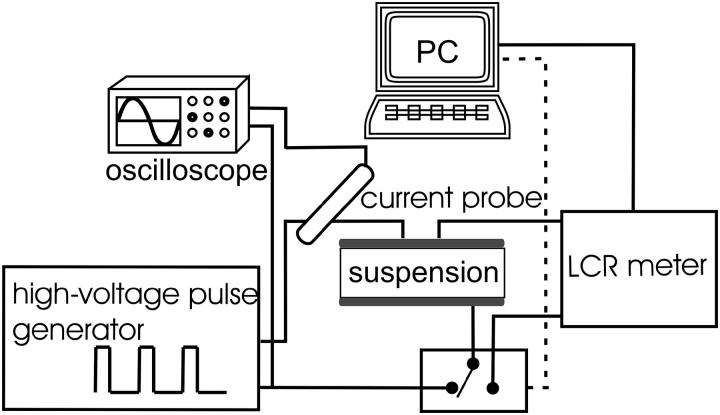
FIGURE 1.
A schematic diagram of the system for electroporation and current-voltage and impedance measurements. The cell suspension (100 μl) was placed between the electrodes. First, impedance was measured then the system switched electrodes to the high-voltage pulse generator and pulses were delivered. Two to three seconds after the pulses, impedance was measured for the second time and after another 10 s for the third time. For each pulse application, voltage, and current were traced on oscilloscope and stored for further analysis.

