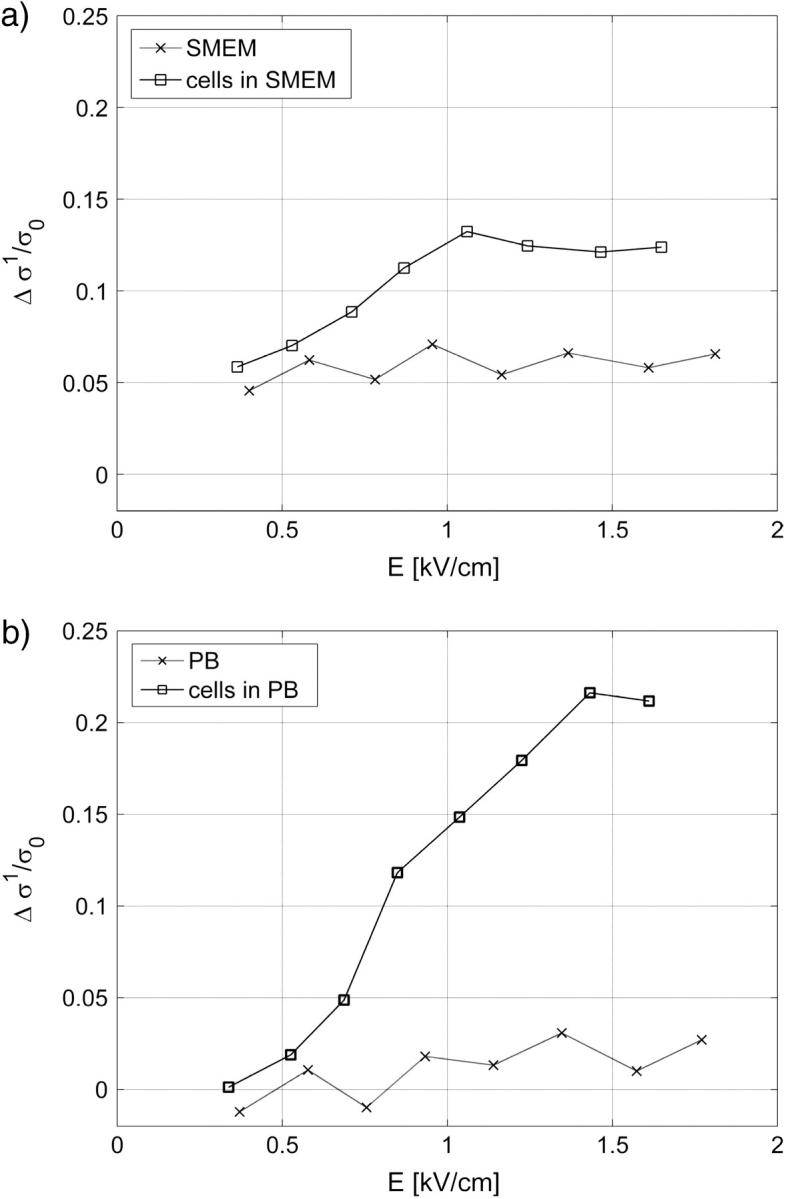
FIGURE 3.

Conductivity change after the first pulse of the train of 8 × 100-μs pulses Δσ1 normalized to initial conductivity in (a) cells in SMEM medium and (b) cells in PB medium, cells in medium (solid line), reference measurement on medium without the cells (dotted line). The results are shown for local electric field E, where E/E0 = 0.91 (f = 0.3).
