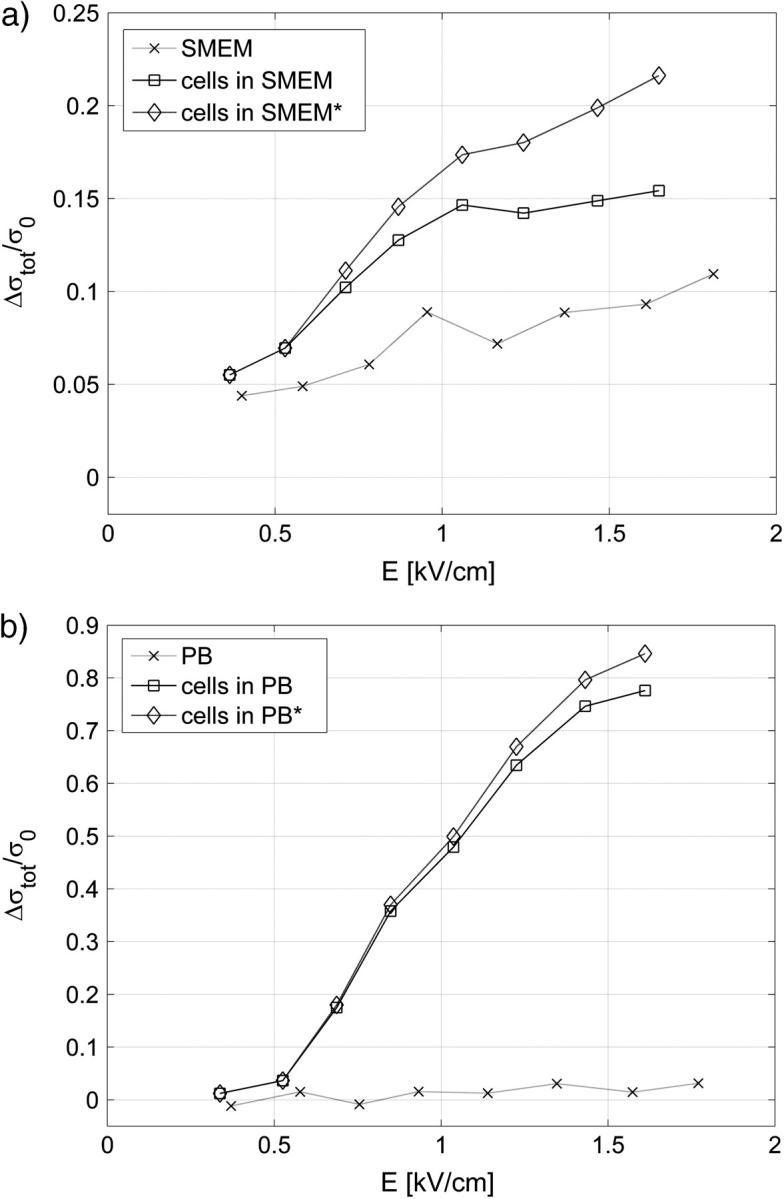
FIGURE 6.

The total conductivity change Δσtot = σ8 − σ0 after the application of 8 × 100-μs pulses (same experiment as in Fig. 3) in (a) cells in SMEM medium and (b) cells in PB medium, cells in medium (solid line), reference measurement (dotted line) on pure medium (×). Note the difference in scale between panels a and b. In Fig. 6 a measured total conductivity change (□) and total conductivity change corrected for the increased cell size due to the colloid-osmotic swelling (⋄) Δσ′tot/σ0 = Δσtot/σ0 − Δσswell/σ0 is shown.
