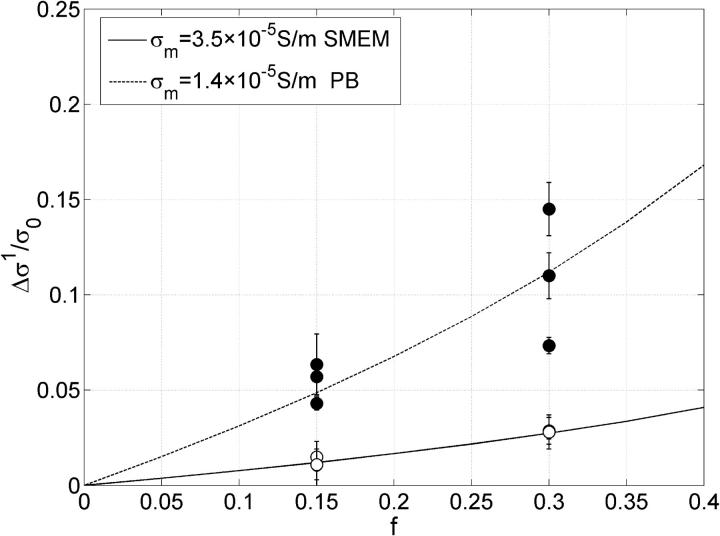
FIGURE 9.
Absolute change in conductivity during the first pulse Δσ1 is shown. Each error bar represents three sample data pooled together, obtained for a train of eight 100-μs pulses of 0.84 kV/cm in SMEM medium (○) and PB medium (•). The conductivity changes in pure SMEM medium were subtracted from the measured value obtained for cells in SMEM. The lines represent values of the theoretical model (see the Materials and Methods section) where membrane conductivity was fitted to obtain the best agreement with measured data.

