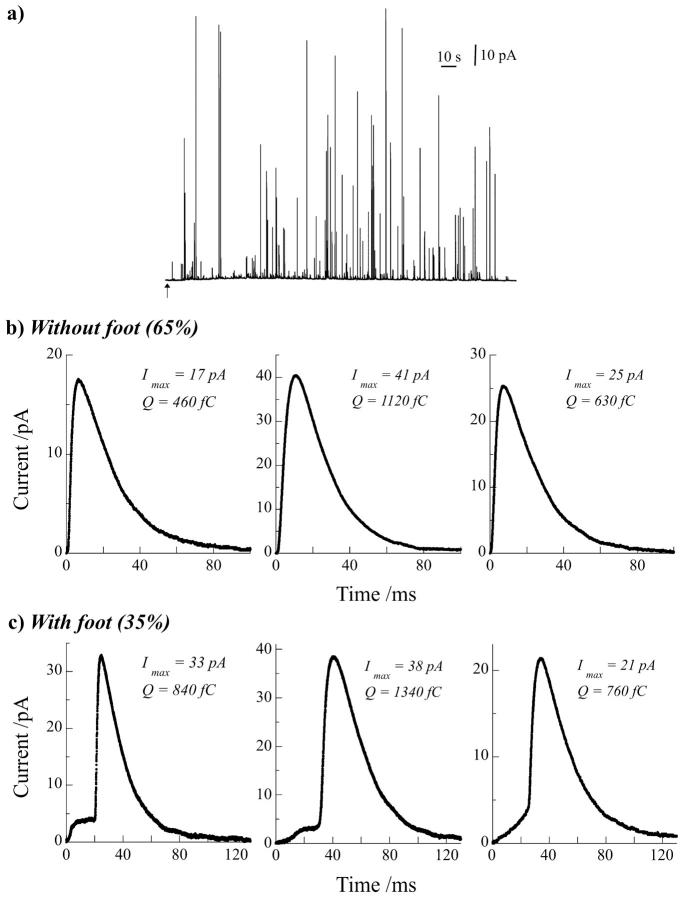
FIGURE 1.
(a) Representative exocytotic response of a bovine chromaffin cell detected by amperometry at a carbon fiber microelectrode. The arrow under the trace represents the start of injection (10 s) on the cell of the stimulus solution containing Ba2+ (2 mM). From these traces three representative amperometric events were extracted without (b) and with a discernable foot (c) preceding the spike. Three different shapes of foot were usually observed (c) that differ on how the foot current onsets (fast versus progressive rise, see left and middle spikes, respectively) and if the foot current linearly increases with time until the spike onset (right spike) or stabilizes as a plateau current after its initial rising phase until the current burst (middle spike). Quantitative parameters of each spike are given.

