
FIGURE 4.
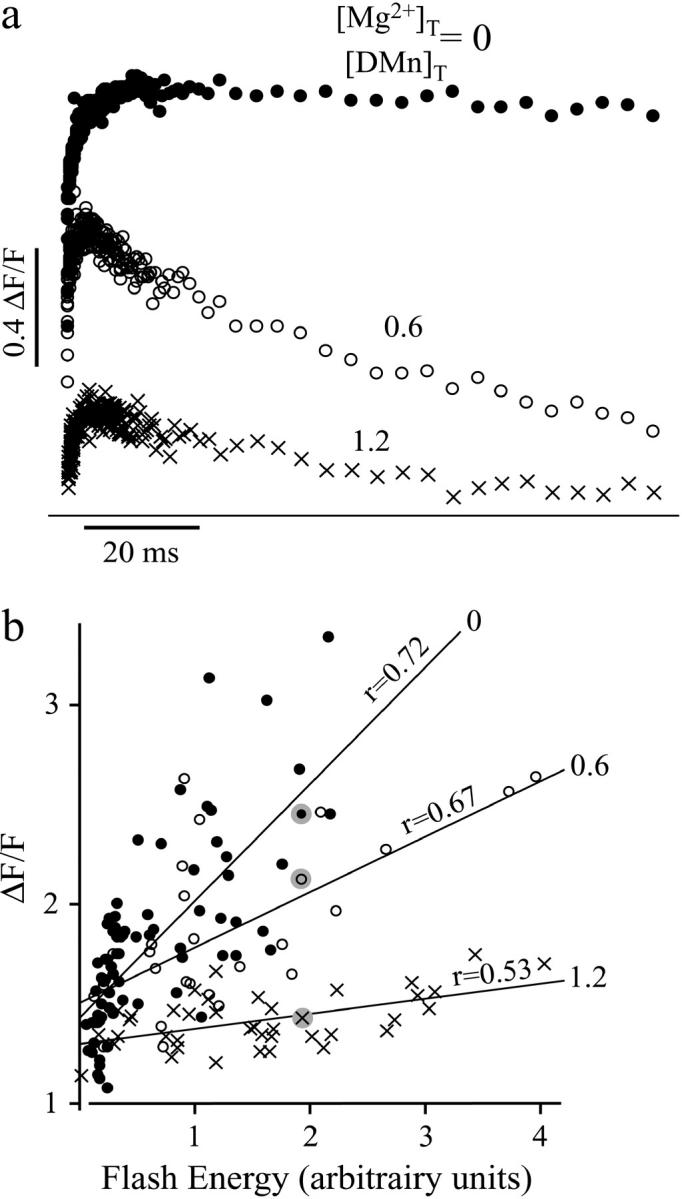
Fluorescence signals increase with increased UV flash energies. (a) Examples of uncaging with similar flash energies, but with different relative amounts of Mg2+(○, no Mg2+, i.e., [Mg2+]T/[DMn]T = 0; •, [Mg2+]T/[DMn]T = 0.6; ×, [Mg2+]T/[DMn]T = 1.2). (b) Linear fits to the plots of the maximum ΔF/F for different relative ratios of [Mg2+]T/[DMn]T as a function of flash energy. Symbols are the same as in a; the shaded dots indicate the maxima of the measurements shown in a.