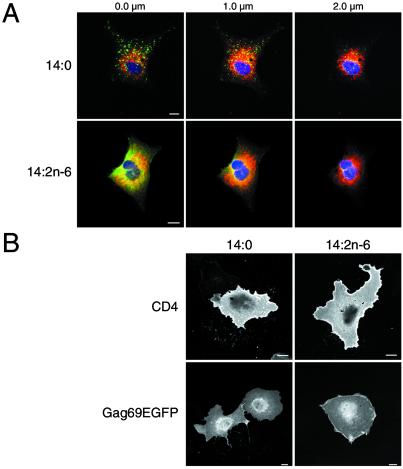
Figure 3.
Membrane localization of Gag. (A) Confocal analysis of 14-carbon fatty acid-treated cells showing successive focal planes of a z stack. The point of attachment closest to the coverslip is 0 μm. GagEGFP fluorescence is green. Protein disulfide isomerase, a luminal ER marker labeled with rabbit anti-protein disulfide isomerase and Cy5 anti-rabbit IgG, is depicted in red. Nuclei are blue. (B) Surface immunolabeling of CD4 using anti-CD4 monoclonal antibody and Alexa Fluor 594 anti-mouse in transiently transfected COS-7 cells (Upper) and GFP fluorescence of Gag69EGFP-expressing cells (Lower). (Scale bars, 10 μm.)

