. 2005 Winter;4(4):323–329. doi: 10.1187/cbe.04-12-0057

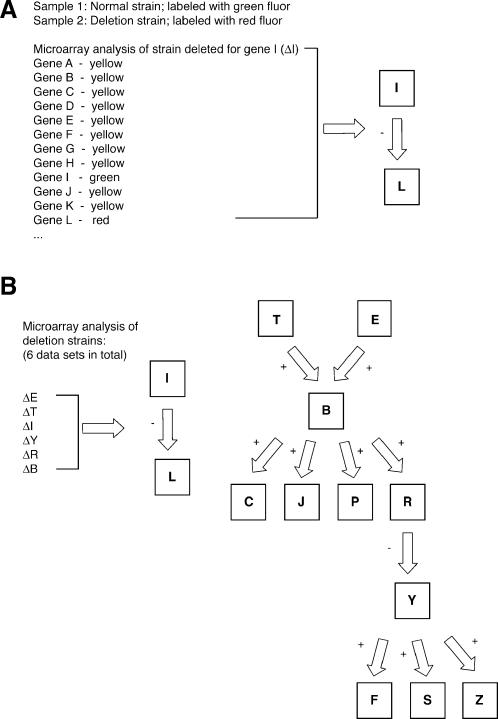
Figure 1. Microarray-based data for student analysis. (A) Partial subset of microarray data describing comparative hybridization of RNA extracted from a strain deleted for gene I with RNA extracted from its wild-type counterpart. The data are presented as a simplified color representation to ease student analysis. The complete microarray data set is provided online as supplementary material. The conclusions drawn from the brief subset of microarray data shown here are indicated to the right. (B) The transcriptional network drawn from the complete microarray data sets. In total, six microarray data sets (indicated on the left) were used to define the signaling modules illustrated on the right. Multiple representations of this transcriptional network can be drawn from the data; these differing interpretations provide ground for further in-class discussion if desired.

Figure 1