. 2005 Winter;4(4):323–329. doi: 10.1187/cbe.04-12-0057

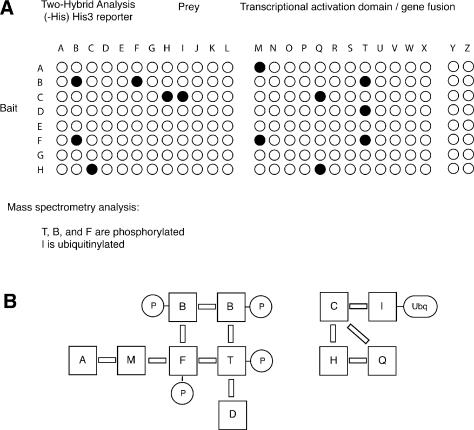
Figure 2. Data sets describing protein–protein interaction and posttranslational modifications. (A) Partial subset of two-hybrid data describing comprehensive pairwise analysis of all pathway components. Data are presented in grid format to simplify student analysis. The complete data set (available online) also presents the results of simple mass spectrometric analysis in which proteins T, B, and F have been found to be phosphorylated, and protein I is ubiquitinylated. (B) Conclusions drawn from the data set in full; multiple interpretations are possible. Solid bars are used to represent protein–protein interactions. Abbreviations: P, phosphoryl group; Ubq, ubiquitin.

Figure 2