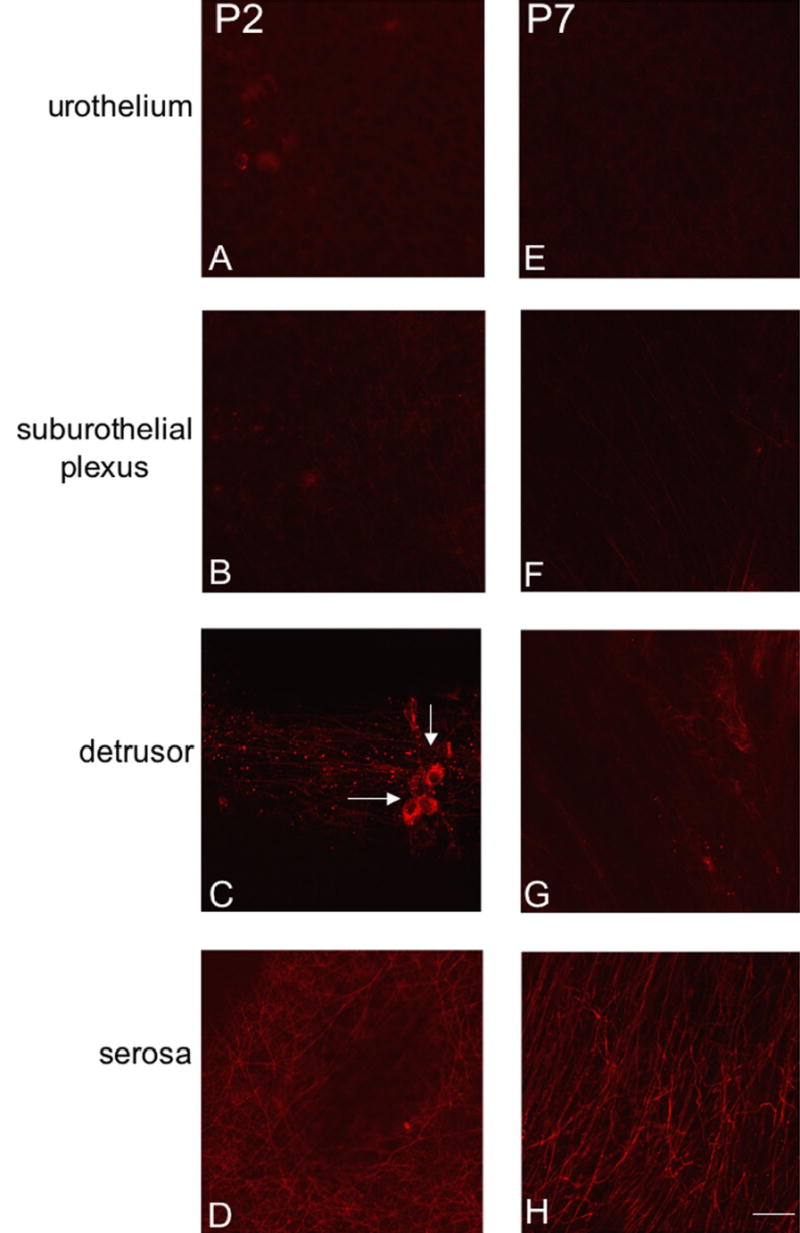
Figure 6.

Fluorescence images of P2X3 receptor expression in urothelium (A, E), suburothelial plexus in bladder trigone or neck (B, F), detrusor (C, G) and serosa (D, H) from postnatal rats, P2-P7. For all images, exposure times were held constant. Expression of P2X3 receptor in the detrusor and serosa was relatively constant. On occasion, isolated or small groups of P2X3-IR cells were observed in close proximity or adjacent to detrusor smooth muscle (C, arrows). P2X3 receptor expression was weak in urothelial cells and sparse P2X3-IR was observed in the suburothelial plexus from P0-P14. Calibration bar represents 50 μm.
