Figure 3.
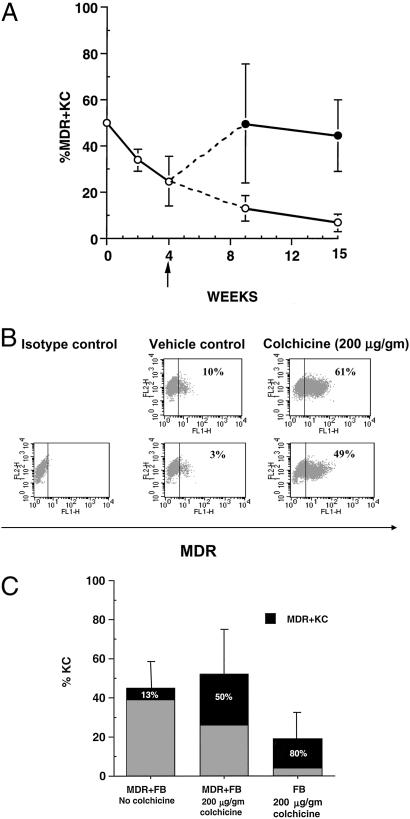
Colchicine treatment increases percentage of MDR+KC and MDR1 expression level over time. (A) Percentage of MDR+KC in grafts (by FACS analysis) at various time points after grafting, either with colchicine treatment starting at week 4 (upper line) or without colchicine treatment (lower line). (B) Representative FACS analysis of grafts treated with vehicle or colchicine at 15 wk; FL1 channel demonstrates level of MDR1 expression. (C) The effect of MDR1-expressing fibroblasts or MDR-negative fibroblasts on the percentage of hKC and percentage of MDR+KC in grafts treated with either vehicle or colchicine, 9 wk after grafting.

