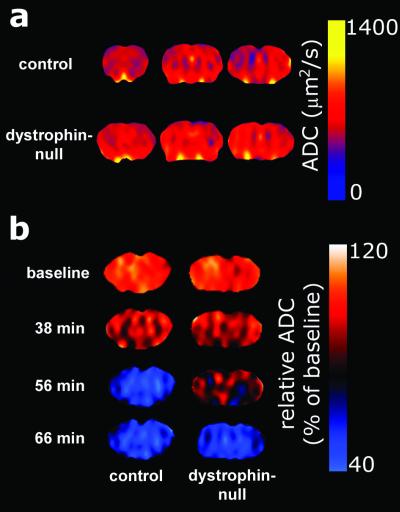
Figure 4.
Representative ADC and relative ADC maps of brains from G178 control mice and dystrophin-null mice. (a) ADC maps were calculated in three consecutive, 2-mm-thick slices, covering the majority of the brain. The profiles for both groups are similar. (b) Relative ADC maps were calculated by normalizing the absolute ADC values to the mean of the three baseline scans on a pixel-by-pixel basis. Note the delay in ADC decline in maps of dystrophin-null mice.

