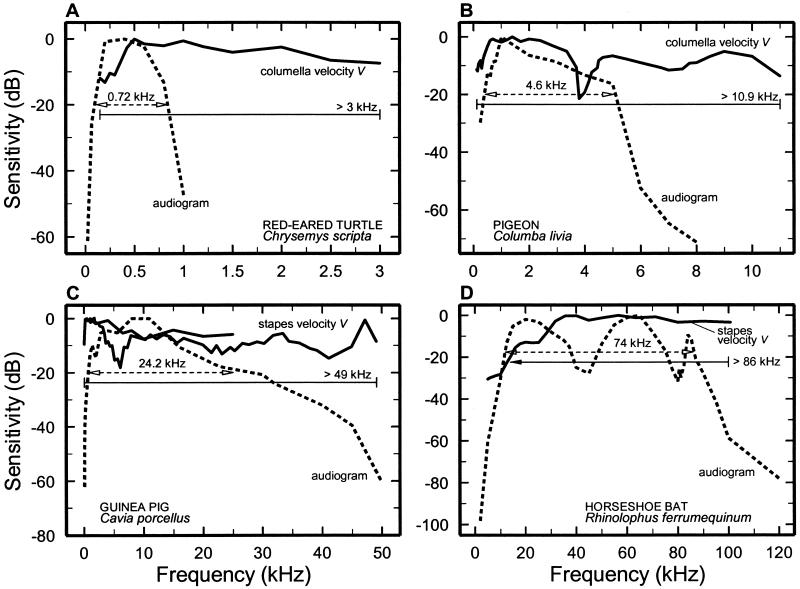
Figure 2.
Comparison between the frequency dependence of behavioral thresholds and stapes or columella vibrations in the turtle (A), pigeon (B), guinea pig (C), and horseshoe bat (R. ferrumequinum) (D). The magnitude of stapes or columella velocity responses to tones (solid curves) and audiometric thresholds (dashed curves) were normalized to their minima and plotted as a function of frequency by using a decibel scale. The horizontal lines indicate bandwidths at −20 dB. (A) Turtle audiogram (59). V, ref. 60. (B) Pigeon audiogram (61). V, ref. 62. (C) Guinea pig audiogram. Median values, refs. 63 and 64; V, refs. 53 and 65. (D) Horseshoe bat audiogram. Median values, ref. 66; V, ref. 67.

