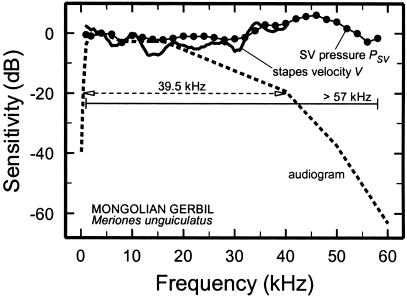
Figure 3.
Frequency dependence of behavioral thresholds, stapes vibrations, and PSV in the gerbil. The magnitudes of V (solid curve) and PSV (symbols) and audiometric thresholds (dashed curve) were normalized to 4 kHz and plotted as a function of frequency by using a decibel scale. The horizontal lines indicate bandwidths at −20 dB. Audiogram, ref. 24; PSV, ref. 25; V, ref. 20.

