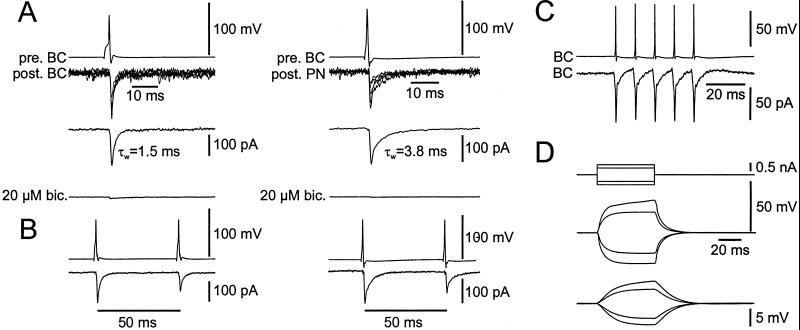
Figure 2.
Fast chemical and electrical transmission at BC–BC synapses in the hippocampus. (A) Unitary IPSCs in a pair of EGFP-labeled BCs (Left) and a pair of an EGFP-positive BC and an EGFP-negative principal cell (Right) in the CA1 subfield. Presynaptic action potentials are shown on top, unitary IPSCs (seven each) are shown superimposed in the center, and average unitary IPSCs (from 20 sweeps) are depicted below. Unitary IPSCs were almost completely blocked by the GABAA receptor antagonist bicuculline methiodide (20 μM; Bottom traces). Note difference in the IPSC decay time constant between the two synapses. (B) PPD of unitary IPSCs in a pair of EGFP-labeled BCs (Left) and a pair of an EGFP-positive BC and an EGFP-negative principal cell (Right) in the CA1 subfield. Action potentials with a 50-ms interpulse interval are shown on top, corresponding average IPSCs (from 30 sweeps) are depicted at the bottom. Note similarity of PPD between the two synapses. Same pairs as those shown in A. (C and D) Electrical coupling in a pair of EGFP-labeled neurons in the DG. In C, the presynaptic cell was held in current-clamp, and the postsynaptic cell was held in voltage-clamp configuration. Lower traces are averages from 31 sweeps. Note that electrical PSCs mirrored presynaptic action potentials. In D, both cells were held in the current-clamp mode, and long de- or hyperpolarizing current pulses were applied. Traces are averages from 15 sweeps. The coupling ratio determined from pre- and postsynaptic voltage changes was 0.2.

