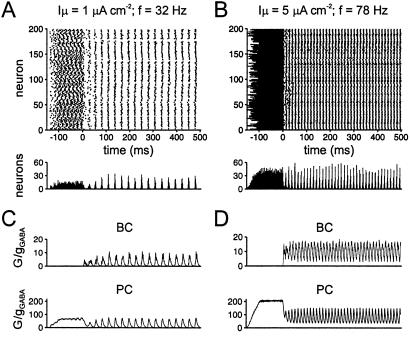
Figure 3.
A “realistic” interneuron network model with fast inhibitory synapses generates coherent activity over the entire gamma frequency range. (A and B) Network activity with standard parameters and unitary postsynaptic peak conductance gGABA = 0.025 mS⋅cm−2. Upper graphs are raster plots, with time on the horizontal axis, and index of the neuron in the network on the vertical axis. Each point represents an action potential. Lower graphs in A and B represent spike frequency histograms for the network; bin width 1 ms. (C and D) Analysis of inhibitory conductances during oscillations. Upper graphs represent the normalized total inhibitory conductance in a single interneuron (cell #1, G/gGABA). The half-duration of the compound conductance changes determined from the last five oscillation cycles was 6.3 ms (C) and 8.1 ms (D), substantially slower than that of the unitary inhibitory conductance (1.4 ms). Lower graphs represent the synaptic output of the interneuron network simulated in a model principal neuron receiving convergent input from all interneurons [synaptic latency, 0.6 ms; decay time constants of unitary conductance, 1.2 ms (60% amplitude contribution) and 7.3 ms (40%), which was the typical inhibitory synaptic conductance change at BC–principal neuron synapses in CA1; see Table 1]. Tonic excitatory drive was applied at random time points −150 ms ≤ t < −100 ms, and chemical and electrical synapses were enabled at t ≥ 0 (type 1 simulation).

