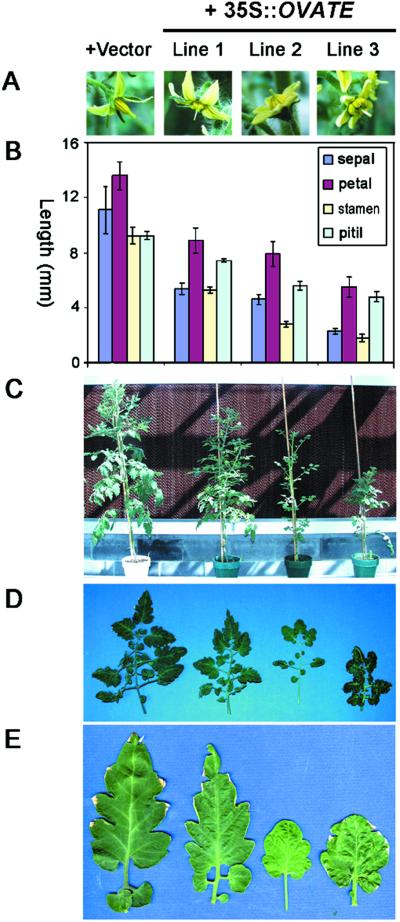
Figure 3.
Previously uncharacterized phenotypes of OVATE-overexpression lines. The pear-shaped line, TA503, was transformed with the binary vector alone (column 1) or 35S∷OVATE (columns 2–4). Lines 1, 2, and 3 represent weaker, modest, and stronger overexpression lines, respectively. (A) Stigma exsertion phenotype of overexpression lines. (B) Measurements of the length of different floral organs (n = 10). (C) Plant growth inhibition by overexpression of OVATE. (D) Suppression of leaf size by overexpression of OVATE. Shown are the tenth leaves from shoot apices of each line. (E) The corresponding top leaflets in D. Stronger overexpression lines (columns 3 and 4) show changed leaflet shape.

