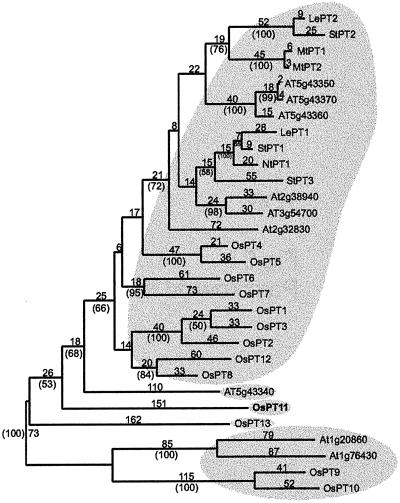
Figure 5.
Maximum parsimony tree of rice and other plant high-affinity Pi transporter proteins. The phylogenetic analysis was performed on the T-COFFEE amino acid alignment with maximum parsimony and bootstrapping. The numbers above the lines refer to the number of sequence changes, the numbers in parentheses refer to bootstrap values.

