Figure 2.
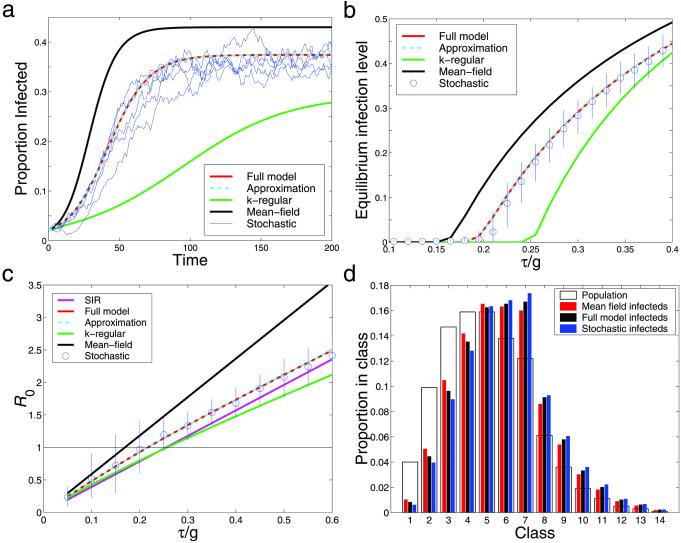
The graphs show stochastic iterations (blue) and four deterministic models carried out on the same computer-generated network: the full pair-wise model (Eq. 6) (red) and the approximation (Eq. 8) (cyan), as well as a mean-field model (Eq. 2) (black) and a k-regular pair-wise model (green) where all individuals are assumed to have the same, mean, number of neighbors k. (a) Typical time series with infection parameter τ/g = 0.35. (b) Equilibrium levels of infection over a range of the parameter τ/g including the mean and 90% confidence intervals from 200 stochastic iterations. (c) The basic reproductive ratio, R0, over a range of the parameter τ/g; also included is the analytic value for an SIR type infection (mauve); the difference between the SIS and SIR approaches is evident. The stochastic R0 is estimated by using the distribution of infection when the epidemic has reached the (low) level of infection at which, in the full model, growth rate hits its early-stage equilibrium. (d) The equilibrium distribution of infected individuals throughout the population compared with the distribution of all individuals, for τ/g = 0.27; more highly connected nodes, representing increasingly promiscuous individuals, are at a greater risk of infection.

