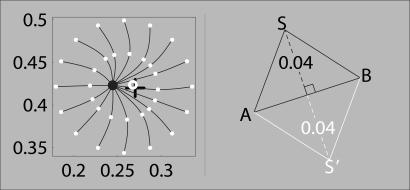
Figure 4.
(Left) A possible alternative interpretation of the data in experiment 2 (here for the pink background; compare with Fig. 3, row 1) in terms of curved lines of constant hue. (Right) Illustration of the choice of infield chromaticities in experiment 3 (see text for details). The black and white lines correspond to two different conditions used for each surround.

