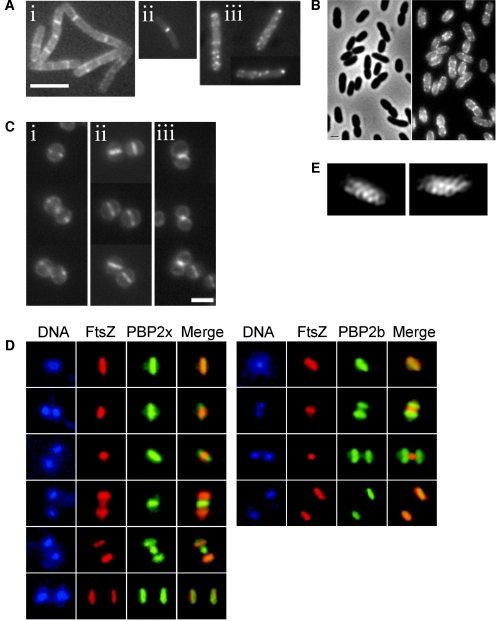
FIG. 5.
Localization of PBPs in different organisms. (A) Three different patterns, i.e., disperse, septal, and spotty, are observed in B. subtilis. Shown are GFP-PbpH (i), GFP-PBP1 (ii), and GFP-PBP3 (iii). Bar, 5 μm. (Adapted from reference 171 with permission of Blackwell Publishing.) (B) Localization of GFP-PBP2 in E. coli. Left, phase-contrast image; right, GFP fluorescence image. Bar, 1 μm. (Adapted from reference 36 with permission of Blackwell Publishing.) (C) Localization of GFP-PBP2 during the S. aureus cell division cycle. GFP-PBP2 localizes as two spots at the start of septum formation (i) and then forms a line indicating localization along the entire closed septum (ii) and remains at the septum site when separation has started (iii). Bar, 2 μm. (Adapted from reference 147 with permission of Blackwell Publishing.) (D) Septal localization of PBP2x (left) and equatorial localization of PBP2b (right) in S. pneumoniae. DNA staining (DAPI [4′,6′-diamidino-2-phenylindol]) (blue), immunofluorescence of FtsZ (red) and PBP2x and PBP2b (green), and an overlay of the FtsZ and PBP patterns (merge), during various stages in the cell cycle are shown. The top and bottom series represent the same localization patterns in a single cell and a diplococcus, respectively. (Adapted from reference 122 with permission of Blackwell Publishing.) (E) Immunostaining of PBP2 in C. crescentus after two-dimensional deconvolution of the fluorescence images. (Adapted from reference 54 with permission of Blackwell Publishing.)

