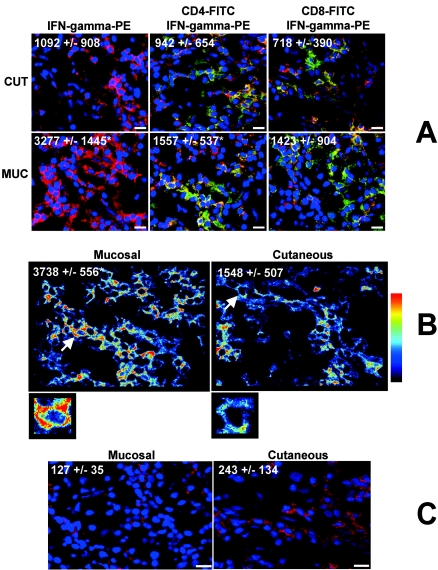
FIG. 1.
Differential expression of IFN-γ and IL-10 receptor in CL and ML lesions. (A) Representative images from confocal microscopy analyses for determination of the numbers of total IFN-γ+ cells, CD4+ IFN-γ+ cells, and CD8+ IFN-γ+ cells in CL (CUT) and ML (MUC) lesions. Tissue sections were stained with FITC-labeled anti-CD4 or anti-CD8 monoclonal antibodies and with PE-labeled anti-IFN-γ and were counterstained with DAPI as described in Materials and Methods. The three optical sections for each patient were obtained simultaneously with lines 363, 488, and 568 of the argon/krypton laser and the proper set of filters. Overlays for CD4 or CD8 (green), IFN-γ (red), and DAPI (blue) in CL and ML lesions are shown. Cells that are double positive for CD4 or CD8 and IFN-γ appear in yellow. These images are representative of each group. Values are the average ± standard deviation for each group following numerical determination of the number of positive cells for the indicated molecule(s). Asterisks indicate statistically significant differences (ML > CL) at a P value of <0.05. CL and ML lesions from 14 and 7 patients, respectively, were analyzed. Bar, 10 μm. (B) Representative analysis of the intensity of expression of IFN-γ in CL and ML lesions by using Pseudocolor software as described in Materials and Methods. The predominance of red indicates a higher intensity of expression than the predominance of blue (see the color scale on the right). White arrows indicate the cells enlarged below. The asterisk indicates a statistically significant difference (ML > CL) at a P value of <0.05. Fourteen CL and seven ML lesions were analyzed. (C) Representative images from the confocal microscopy analysis for determination of the numbers of total IL-10 receptor-positive cells in CL and ML lesions. Tissue sections were stained with a PE-labeled monoclonal antibody against the IL-10 receptor as described in Materials and Methods. A total of nine CL and seven ML lesions were analyzed. Bars, 10 μm. The images are representative of one of two independent experiments for each individual lesion. Values are the average ± standard deviation for each group from the numerical analysis of the number of cells expressing the indicated molecule(s).

