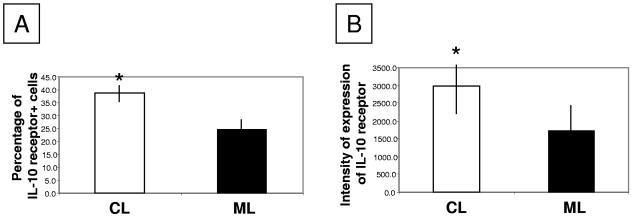
FIG. 2.
Analysis of the expression of the IL-10 receptor in CL and ML lesions. (A) Percentage of cells expressing the IL-10 receptor in CL and ML lesions; (B) intensity of expression of the IL-10 receptor per cell. Tissue sections were stained with PE-labeled monoclonal antibodies against the IL-10 receptor and counterstained with DAPI, and the number and percentage of cells expressing the IL-10 receptor, as well as the intensity of its expression, were calculated as described in Materials and Methods. Asterisks indicate statistically significant differences between groups at a P value of <0.05. Nine CL and seven ML lesions were analyzed.

