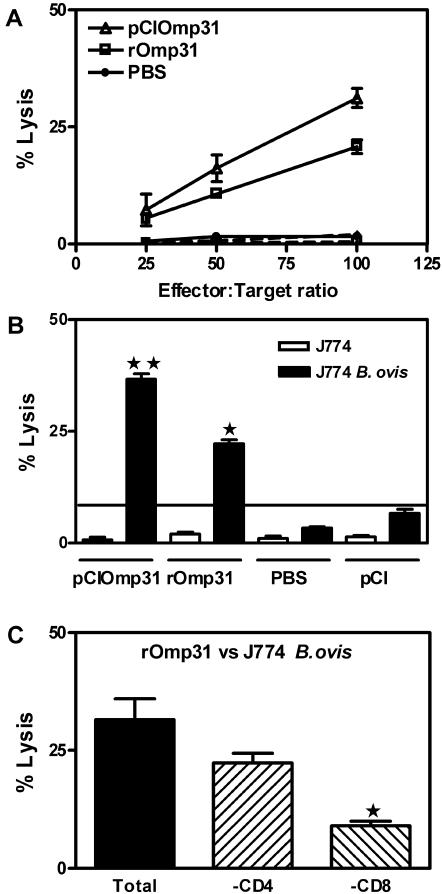
FIG. 3.
Induction of Omp31-specific CTLs in spleen cells from rOmp31-immunized mice. Cytotoxicity was detected in a standard 6-h 51Cr-release assay. (A) Target cells were A20JpCI (dashed lines) or A20JOmp31 (solid lines) cells labeled with 51Cr. Effector cells were the splenocytes from rOmp31-, PBS-, or pCIOmp31-immunized mice previously cultured for 5 days with mitomycin C-treated A20JOmp31. The cytotoxicity was measured at the indicated effector/target ratios. Each value represents the mean ± SD of the responses of spleen cells from five individual mice. The data are representative of two separate experiments. (B) Vaccination with rOmp31 elicited CTLs that lyse Brucella-infected macrophages in vitro. Cytotoxicity was detected in a standard 6-h 51Cr release assay. The effector/target ratio was 100:1. Target cells were J774 or J774 B. ovis. Effector cells were the splenocytes from rOmp31-, PBS-, pCIOmp31-, or pCI-immunized mice previously cultured for 5 days with mitomycin C-treated A20JOmp31. Each value represents the mean plus SD of the responses of spleen cells from five individual mice. The data are representative of two separate experiments. ★★, significantly different from pCI-immunized mice (P < 0.01); ★, significantly different from PBS-immunized mice (P < 0.05). (C) Target cells were J774 B. ovis. The effector/target ratio was 100:1. rOmp31-specific effector cells were depleted of CD4+ T cells (-CD4+) or CD8+ T cells (-CD8+) using mouse CD4 (L3T4) Dynabeads or mouse CD8 (Lyt2) Dynabeads or were not depleted (Total). Each value represents the mean of triplicates plus SD of the responses of a pool of spleen cells from five mice. ★, significantly different from undepleted (Total) cells (P < 0.05). The data are representative of three separate experiments.

