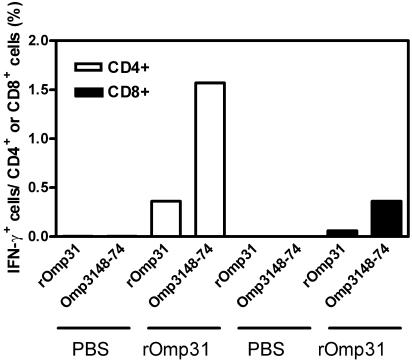
FIG. 4.
Three-color flow cytometric analysis of intracellular IFN-γ expression versus cell surface markers in spleen cells from PBS- or rOmp31-immunized mice. The graph shows the percentages of CD4+ or CD8+ cells producing intracellular IFN-γ after stimulation with rOmp31 or Omp3148-74 as described in Materials and Methods. Spontaneous (unstimulated) percentages have been subtracted. Each value represents the responses of a pool of spleen cells from five mice. The data are representative of two separate experiments.

