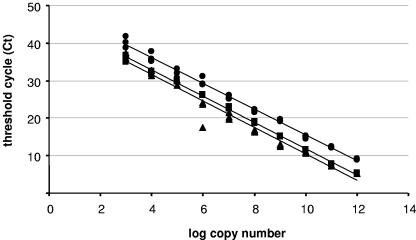
FIG. 1.
Standard curves for uspA1 (•), hag (▪), and recA (▴). Serial dilutions (10-fold) of in vitro-transcribed RNA were subjected to reverse transcription and amplified by real-time PCR in triplicate. Resulting CT values were plotted against the log10 values of copy numbers. Regression curves revealed a linear relationship over 10 orders of magnitude (1012 to 103 copies) as follows: log (uspA1 copy number) = (49.97 − CT)/3.45, r2 = 0.99; log (hag copy number) = (46.65 − CT)/3.48, r2 = 0.99; log (recA copy number) = (46.82 − CT)/3.61, r2 = 0.97.

