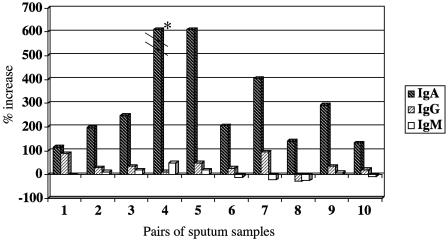
FIG. 1.
Distribution of M. catarrhalis-specific immunoglobulin isotypes determined by flow cytometry using preacquisition and postclearance sputum supernatants with the homologous infecting strain. The x axis shows samples from 10 individual patients. The y axis indicates the percent increase of antibody in paired preacquisition and postclearance sputum samples determined by flow cytometry. Immunoglobulin isotypes are noted in the legend on the right. *, the percent increase of IgA in sample 4 was actually 1,425%.

