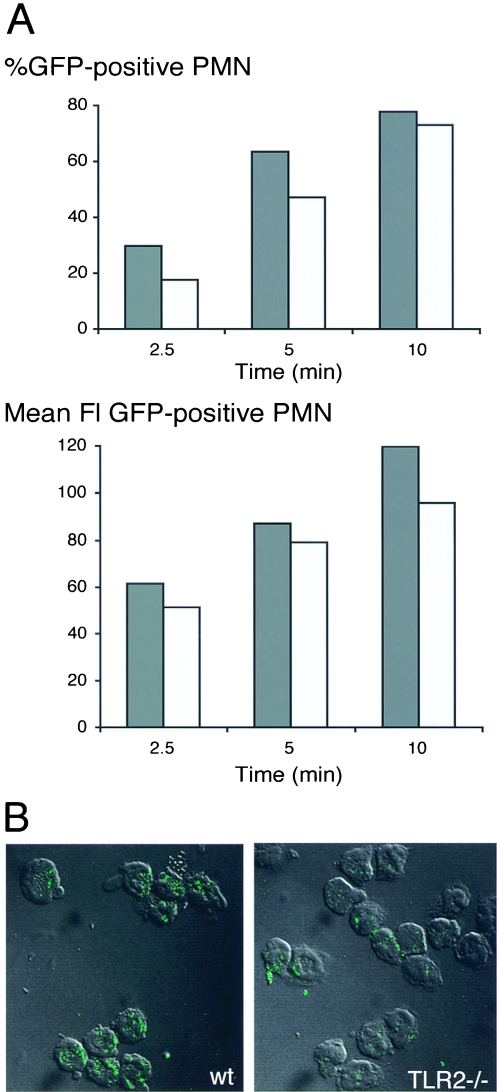
FIG. 3.
(A) Percentage GFP-positive PMN and mean FI of GFP during phagocytosis by WT and TLR2−/− PMN. Plasma-opsonized GFP-C5017 S. pneumoniae cells were incubated at an MOI of 100:1 with WT (dark gray columns) and TLR2−/− (light gray columns) PMN for 2.5 to 10 min at 37°C and then washed, and the percentages of GFP-positive PMN (top panel) and mean FI (lower panel) of a scatter-gated viable PMN population were analyzed by FACS. One out of three similar experiments is shown. (B) Confocal micrography of GFP-C5017 S. pneumoniae phagocytosis by WT (left) and TLR2−/− (right) PMN after 2.5 min. Transmission micrographs of combined serial Z-stacks 0.5 μm thick showing PMN that have internalized GFP bacteria. Scale bars, 10 μm.

