
Figure 3.
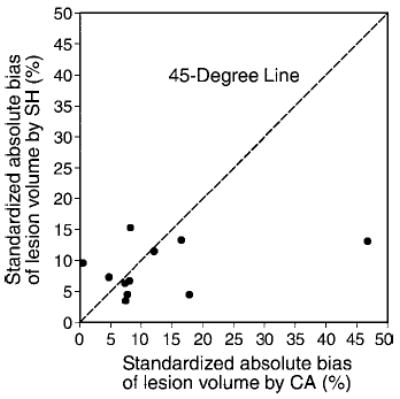
Scatterplot of percentage absolute bias of lesion volume according to SH, against percentage absolute bias of lesion volume according to CA, each standardized according to pathologic volume. Eight (ie, lesions 1, 2, 4, 5, 7, 8, 10, and 11) of the 11 lesions had smaller absolute biases with the SH method than with the CA method, with data points lying under the 45° line.