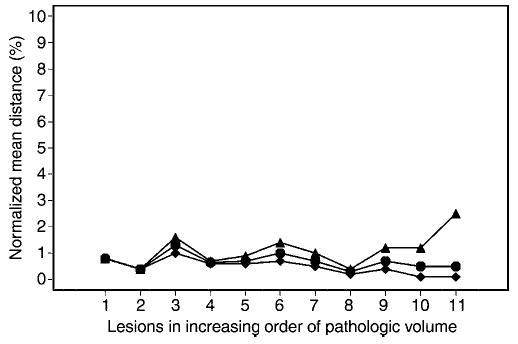
Figure 6.

Graph shows lesion-specific percentage normalized mean distance, with individual lesions presented in increasing order of pathologic volume. Overall range of the normalized distance was less than 2.5%. Normalized distance tended to be smaller for larger lesions with larger normalizing lesion area. ▴ = Maximum of mean distances over all contours per lesion. • = Average of mean distances over all contours per lesion. ♦ = Minimum of mean distances over all contours per lesion.
