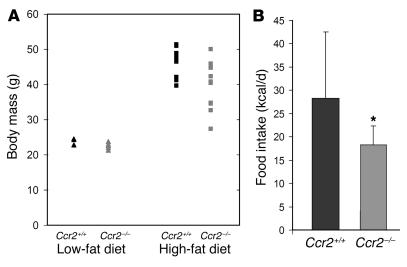
Figure 2.
Body mass of Ccr2–/– mice. (A) C57BL/6J Ccr2+/+ (black symbols) and Ccr2–/– (gray symbols) mice were fed a low-fat (triangles) or a high-fat diet (squares) for 24 weeks. There was no significant difference in body mass between mice of each genotype on the low-fat diet (n = 5; P > 0.05). The mean body mass of Ccr2–/– mice fed a high-fat diet was significantly lower than that of the Ccr2+/+ mice (39.3 ± 6.9 g vs. 46.3 ± 4.1 g; n = 10; P < 0.05). (B) Average daily food intake was measured over a 6-week period for Ccr2+/+ and Ccr2–/– mice fed a high-fat diet. *P < 0.05 vs. Ccr2+/+.

