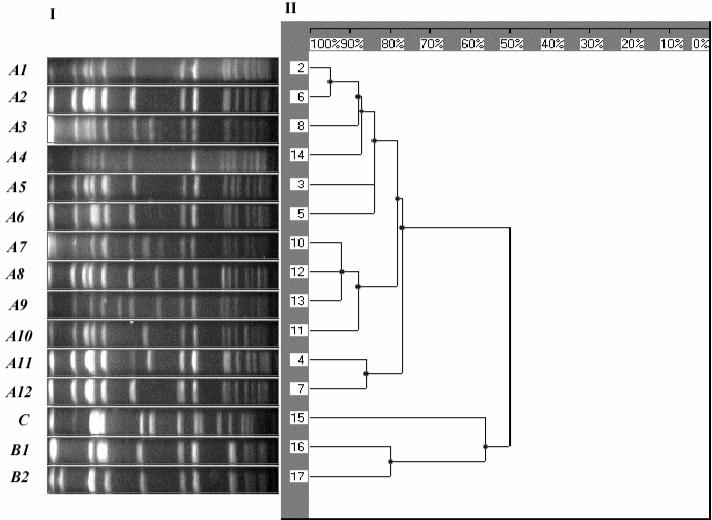
FIG. 1.
(Panel I) PFGE image with the SmaI restriction pattern of the main MRSA types and subtypes found in our study; the spectrum of restriction fragments shown ranges between 700 kb (to the left) and 10 kb (to the right) (molecular weight standard not included in the picture). (Panel II) Dendrogram based on the Dice coefficient of pattern similarity.

