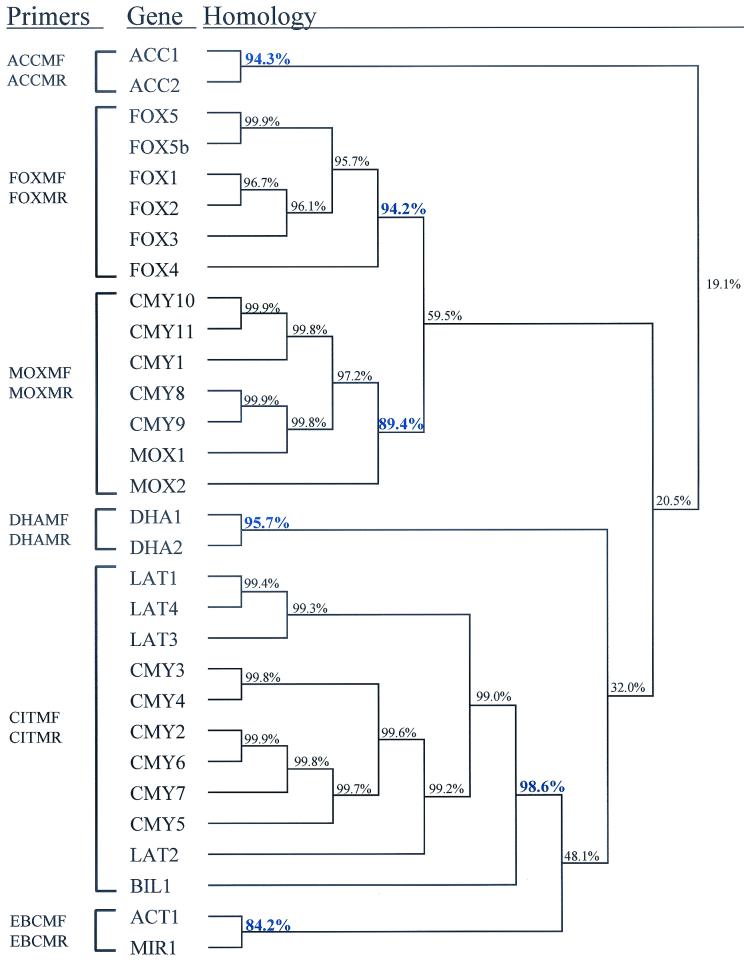
FIG. 1.
AmpC dendrogram. Sequences were downloaded from the GenBank database, and structural genes were compared, as described in Material and Methods, by using the DNAsis program. Values in blue correspond to the percent similarity between the most distinct member of each cluster and the other members within that cluster. Primer pairs are correlated by the family of genes that they amplify.

