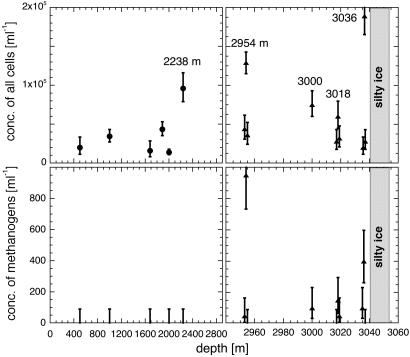
Fig. 3.
Concentrations of all cells (Upper) and of methanogens (Lower). Syto-23 stain was used to visualize fluorescence of all cells, and F420 autofluorescence was used to image methanogenic cells. Measurements were made with both Syto-23 and F420 on the same samples at all depths except at 1,887 m. Error bars indicate counting statistics. Upper limits at 90 cells per ml correspond to a null count at an 84% confidence level. At depths ≈1 m above and below the values at 2,954, 3,018, and 3,036 m, the concentrations drop to background values, just as was the case for methane in Fig. 1.

